

The Super Bowl Theory: When Football Meets Wall Street

Every February, investors and sports fans alike dust off one of Wall Street’s most entertaining indicators: the Super Bowl Indicator. First identified by New York Times sportswriter Leonard Koppett in 1978, this theory suggests that if a National Football Conference team wins the Super Bowl, the stock market will rise for the year. If an American Football Conference team wins, the market will fall.
It sounds absurd. And yet, the indicator maintained an 80% accuracy rate through its early decades. The question is: does it still work?
The Past Decade: A Mixed Scorecard
Let’s examine the last 10 years of Super Bowl outcomes against Nasdaq 100 returns:
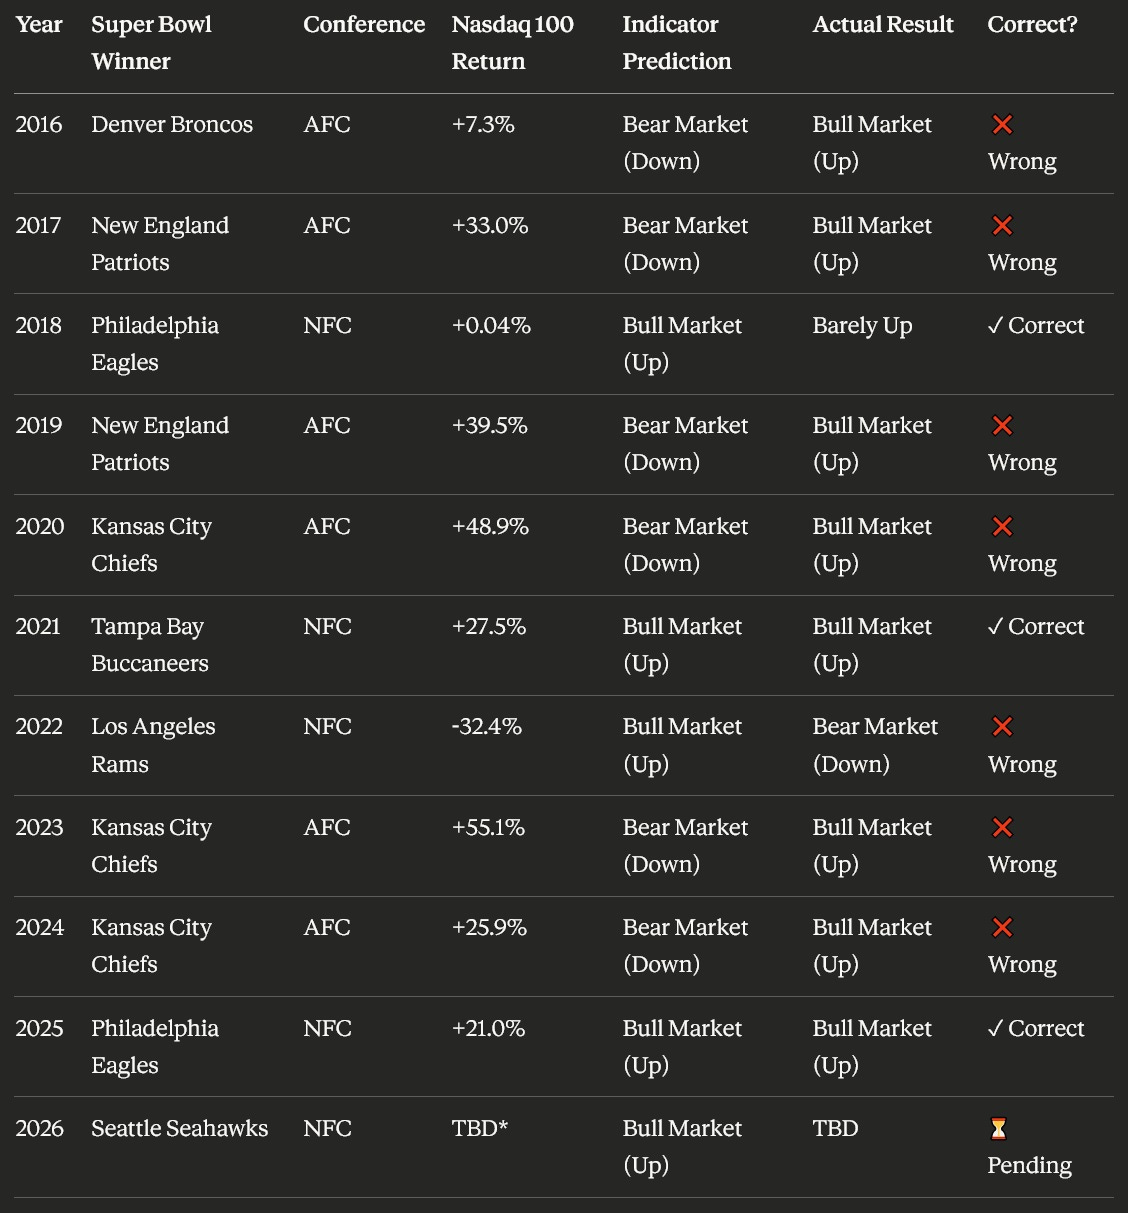
11-Year Accuracy Rate: 27% (3 out of 11 correct, 1 pending)
*As of February 8, 2026, the year has just begun, so we won’t know the full-year Nasdaq 100 return until December 31, 2026.
The Seahawks’ NFC victory predicts a bull market for 2026. We’ll revisit this at year-end to see if the indicator finally gets one right—though based on the past decade, don’t bet your portfolio on it.
The indicator’s recent performance? Terrible. AFC teams won six of the past ten Super Bowls, which should have predicted bear markets according to the theory. Instead, the market was positive in nine of those ten years. The only down year was 2022, when an NFC team (the Rams) won—the exact opposite of what the indicator predicted.
In the last decade, the Super Bowl Indicator was wrong 70% of the time. A coin flip would have been more accurate.
The Theory’s Peak and Decline
The indicator’s accuracy has eroded significantly since its heyday. Between 1967 and 1997, it boasted a 90% success rate. From 1978 to 2022, accuracy dropped to 67%. Since 2000, it has been correct only 46% of the time. Recent data shows AFC wins have corresponded with positive market returns 12 of the last 13 years, completely contradicting the original theory.
The historical data does show interesting patterns. When NFC teams have won the Super Bowl since 1967, the S&P 500 has averaged a 10.2% gain. When AFC teams have won, the average gain was 8.1%. Both are positive—hardly the bear market the theory predicts for AFC victories.
The Psychology Behind the Pattern
This is where the Super Bowl Indicator becomes instructive for investors. The phenomenon illustrates several critical psychological biases that plague investment decision-making.
Illusory Pattern Recognition is the tendency to see meaningful patterns in random data. Our brains evolved to detect patterns for survival, but this hardwiring becomes a liability in financial markets. The Super Bowl Indicator is a textbook example of spurious correlation—two variables that appear related but have no causal connection. Research shows that stress and uncertainty increase illusory pattern recognition. In volatile markets, investors become more susceptible to seeing correlations that don’t exist.
Confirmation Bias leads investors to seek information that confirms existing beliefs while ignoring contradictory evidence. Those who believed in the Super Bowl Indicator during its successful run were likely to explain away failures as anomalies rather than evidence the theory was breaking down.
Hindsight Bias makes past events seem more predictable than they actually were. The indicator’s early success led many to believe it had genuine predictive power, when in reality it was statistical noise that happened to align with market outcomes for a period.
The Super Bowl Indicator also demonstrates the Gambler’s Fallacy—the mistaken belief that if something happens more frequently than normal during a given period, it will happen less frequently in the future. Investors might think “an AFC team has won five years straight, so an NFC team is due”—but each game is independent of previous outcomes.
The Real Lesson
The Super Bowl Indicator isn’t completely worthless. Its value lies in what it teaches us about ourselves. Markets are driven by fundamentals: earnings, interest rates, economic growth, monetary policy. A football game has zero causal impact on these variables.
Yet investors consistently search for shortcuts, patterns, and signals that promise to give them an edge. The indicator’s decline in accuracy coincides with the rise of algorithmic trading, passive index investing, and global capital flows—factors that dwarf any supposed correlation with a sporting event.
Behavioral finance research consistently shows that investors who recognize their cognitive biases make better decisions. The Super Bowl Indicator serves as a reminder to distinguish between correlation and causation, to maintain healthy skepticism about market folklore, and to focus on evidence-based investing rather than entertaining anecdotes.
Don’t Let Your Portfolio Play by Outdated Rules
Here’s the uncomfortable truth: if you’re basing investment decisions on folklore like the Super Bowl Indicator, what other outdated theories are quietly eroding your wealth? The financial world is littered with strategies that worked once but stopped working years ago. The problem is, most investors don’t realize when the game has changed.
Your portfolio deserves better than stagnant theories and unexamined beliefs. It deserves a disciplined, evidence-based approach grounded in actual market dynamics, not entertaining myths.
The real question isn’t whether the Patriots or Seahawks will win the Super Bowl. It’s whether your investment strategy is built on solid fundamentals or crumbling assumptions. It’s whether your portfolio is positioned for the market we have today, not the market of 1978.
Contact us today to review your portfolio. Let’s identify the hidden biases, outdated strategies, and spurious correlations that might be costing you returns. Don’t let superstition and stagnant beliefs end your financial game before the fourth quarter even begins.
After all, in investing as in football, winning requires discipline, strategy, and knowing when to call an audible.
Sources:
Wikipedia. “Super Bowl Indicator.” (2026).
Kiplinger. “Super Bowl Indicator 2026: A Structural Analysis.” (2026).
AARP. “Why the Super Bowl Is a Stock Indicator.” (2025).
Earn2Trade. “The Super Bowl Indicator: AFC & NFC Wins as Market Clues.” (2023).
Nasdaq Index Research. Nasdaq-100 Total Return Index Historical Data (2026).
Investment Banking Council of America. “How Behavioral Finance Shapes Investor Psychology.” (2025).
Copyright © 2026 All rights reserved. This blogi is copyright protected. No part may be reproduced, altered, or copied in any form without written consent. Information contained herein is for informational purposes only and should not be construed as an offer, solicitation, or recommendation to buy or sell securities, or personalized investment, tax or legal advice. The information has been obtained from sources believed to be reliable; however no guarantee is made or implied with respect to its accuracy, timeliness, or completeness. Authors may own the stocks they discuss. The information and content are subject to change without notice. Treveri Capital LLC is a California registered investment advisor. CRPC®, Chartered Retirement Planning CounselorSM are trademarks or registered service marks of the College for Financial Planning in the United States and/or other countries.